Target profit analysis
In previous pages of this chapter, we have focused mainly on the break-even point. However, the core objective of every business is not just to break even, but to earn a decent amount of profit.
Sometime management wants to earn a certain amount of profit during a certain period of time. This certain amount of profit is commonly known as target profit.
Target profit analysis is about finding out the estimated business activities to perform to earn a target profit during a certain period of time. Among these activities, management is especially interested to find out the sales volume required to generate a target profit.
In break-even point analysis article, we used equation method and contribution margin method to calculate break-even point of a company. The same formulas, with a little modification, can be used to calculate the sales both in units and in dollars to earn a target profit during a certain period of time.
Equation method for target profit:
The target profit equation is given below:
Sp × Q = Ve × Q + Fe + Tp
or
SpQ = VeQ + Fe + Tp
Where;
Sp = Sales price per unit.
Q = Number (quantity) of units to be manufactured and sold during the period.
Ve = Variable expenses to manufacture and sell a single unit of product.
Fe = Total fixed expenses for the period.
Tp = Target profit for the period.
Contribution margin method for target profit:
Under this method, the target profit is added in the total fixed expenses and the resultant figure is then divided by the unit contribution margin.
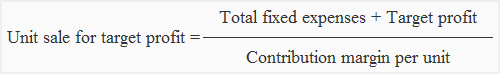
Notice that to get target profit formulas or equations, we have just included the target profit to break-even point formulas.
Example 1:
The HK company manufactures a single product – product X. A unit of product X is sold to customers for $80. The per unit variable expense and the total expected fixed expenses for the first quarter of the year 2012 are as follows:
- Variable expenses to manufacture and sell a unit of product X: $50
- Total fixed expenses for the first quarter of the year 2012: $40,000
The company wants to earn a profit of $80,000 for the first quarter of the year 2012.
Required:
Calculate sales in units and in dollars to earn a target profit of $80,000 during the first quarter of 2012 using:
- Equation method
- Contribution margin method.
Solution:
1. Equation method:
SpQ = VeQ + Fe + Tp
$80Q = $50Q + $40,000 + $80,000
$80Q – $50Q = $40,000 + $80,000
$30Q = $120,000
Q = $120,000 / $30
Q = 4,000
The company will need to sell 4,000 units of product X to earn a profit of $80,000. We can calculate the sales in dollars by simply multiplying the number of units to be sold by the sales price per unit as follows:
= 4,000 units × $80
= $320,000
2. Contribution margin method:
(Target profit + fixed expenses)/contribution margin per unit
= ($40,000 + $80,000) / $30*
= 4,000 units
Or
= 4,000 units × $80
= $320,000
*Unit contribution margin is equal to sales price per unit less variable expenses per unit i.e., $80 – $50.
Example 2
The John & David Corporation provides you the following data:
- Selling price per unit: $140
- Variable cost per unit: $90
- Expected annual fixed expenses: $400,000
Required:
- Determine the break even point of John & David Corporation using above data.
- Based on the above data, how many units the corporation needs to sell for making a profit of $200,000 for the next year?
- Prepare a projected contribution margin income statement with the help of original data given in the problem and your answer to requirement 1.
- Present the information on a CVP graph and show the break-even point and sales volume required to earn the target profit of $200,000.
- What would be the margin of safety in dollars and in units if the corporation achieves the sales volume required to make the target profit of $200,000 next year?
Solution
1. Break even point
Break even point in terms of units:
Fixed cost/(Selling price per unit – Variable cost per unit)
= $400,000/($140 – $90)
= $400,000/$50
= 8,000 units
Break even point in terms of dollars:
Break even point in units × Selling price per unit
= 8,000 units × $140
= $1,120,000
2. Required sales volume to earn $200,000
Sales volume required in terms of units:
(Fixed cost + Target profit)/(Selling price per unit – Variable cost per unit)
= ($400,000 + $200,000)/($140 – $90)
= $600,000/$50
= 12,000 units
Sales volume required in terms of dollars:
Sales volume in units × Selling price per unit
= 12,000 units × $140
= $1,680,000
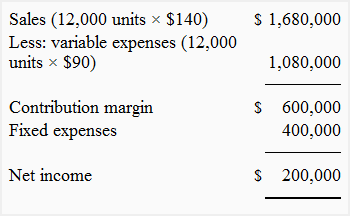
3. Projected income statement for the next year
4. CVP graph with break even point and target sales
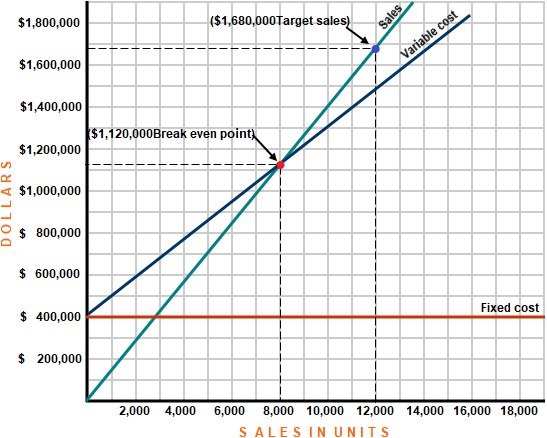
In above CVP chart, red dot represents break-even sales and blue dot represents target sales. We can observe that the corporation breaks even at a sales volume of $1,120,000 and target sales for the next year are $1,680,000 which are $560,000 higher than the break-even sales.
5. Margin of safety
The margin of safety in this problem is equal to target sales volume less break even sales volume.
Margin of safety in dollars:
Target sales in dollars – Break even sales in dollars
= $1,680,000 – $1,120,000
= $560,000
Margin of safety in units:
Target sales in units – Break even sales in units
= 12,000 units – 8,000 units
= 4,000 units
OR
Margin of safety in dollars/Selling price per unit
= $560,000/$140
= 4,000 units
Leave a comment