Net present value (NPV) profile
The net present value profile (or NPV profile, for short) is a graphical representation of the relationship between a project’s net present value (NPV) and different corresponding discount rates. It depicts how sensitive a project’s NPV is to a change in firm’s discount rate or cost of capital.
To construct a project’s NPV profile, the discount rates are plotted on X-axis and the net present values are plotted on Y-axis. The two important outcomes of an NPV profile are the internal rate of return (IRR) and the crossover rate. The IRR is the point where NPV curve interests the X-axis i.e., discount rate axis. This point reveals a discount rate that yields a zero net present value for the project.
The crossover rate is relevant only when two projects are plotted together on the same graph. It is the point where NPV curves of two different projects intersect each other. This point corresponds to a discount rate on X-axis which results in equal net present values for both the projects. Let’s illustrate the construction of an NPV profile through an example.
Example
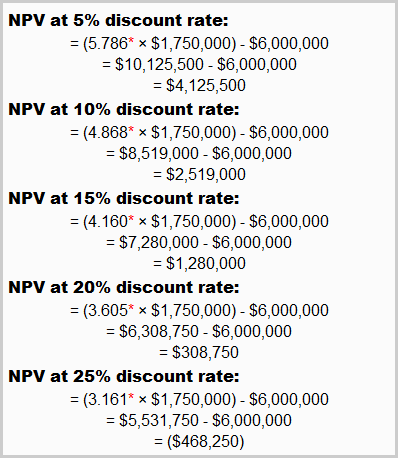
ABC Company has an opportunity that needs an initial investment of $6 million and is expected to bring in a net annual cash flow of $1,750,000 for 7 consecutive years. We can examine the sensitivity of the project’s net present value (NPV) to the change in discount rate by determining the NPV at different discount rates. Let’s, suppose, the company applies 5%, 10%, 15%, 20% and 25% discount rate to this project. The project’s NPV at these rates can be calculated as follows:

*Values from “present value of an annuity of $1 in arrears table“.
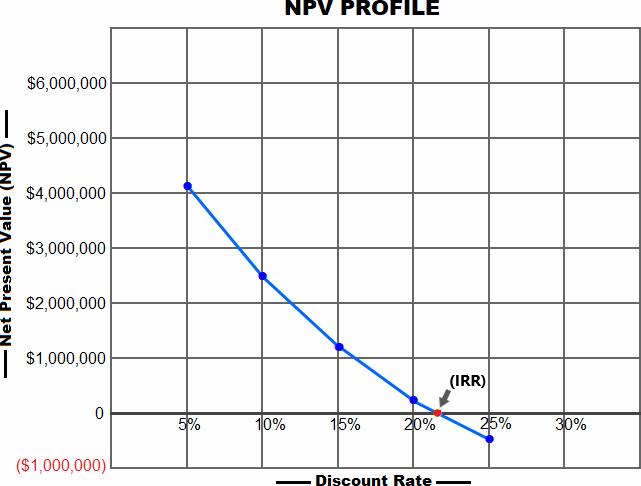
We can plot the above net present values (NPVs) and their corresponding discount rates to depict the NPV profile of the project as follows:

In NPV profile above, the downward slope of NPV curve shows that the project’s net present value lowers as the discount rate rises. The NPV curve behaves like this with most of the projects. Let’s explain a bit why it happens.
At higher discount rates, the cash movement that happens at the early stage of the project heavily influences its net present value. Since many projects tend to cause a large capital outlay at the time of their inception, the NPV profile generally exhibits a negative or inverse relationship between the net present value and discount rate assumed.
The point where the NPV curve intersects the X-axis (highlighted by a red dot) is the internal rate of return (IRR) – the discount rate which equates the NPV to zero. The IRR in this case falls somewhere between 20% to 25%.
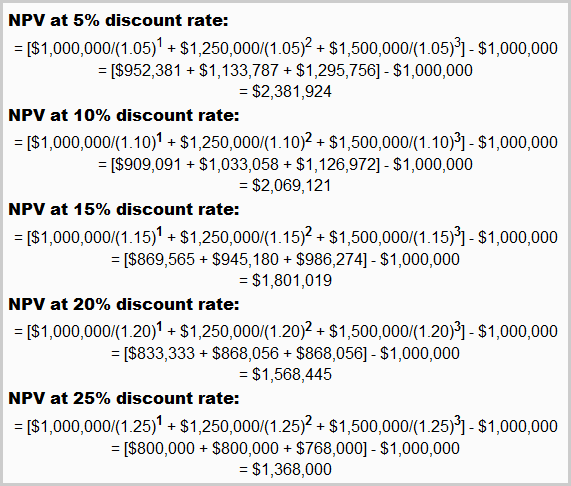
Now assume further that the company has another project to consider which requires $1 million to start and is expected to generate the following net cash inflows over its three years life:
- Year 1: $1,000,000
- Year 2: $1,250,000
- Year 3: $1,500,000
Assuming the same discount rates as applied to the first project, we can find the NPV of the second project as follows:

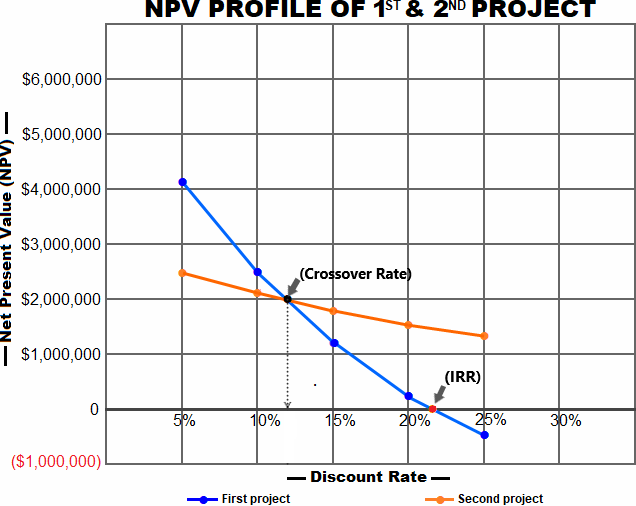
Now that we have determined the NPV of second project, we can plot its NPV profile along with the first project to find the crossover rate of two projects. The crossover rate is the discount rate at which the company is indifferent between two opportunities because it equates the net present value of both.

In above graph, the point at which the two NPV curves cross each other represents the crossover rate of the projects.
Uses of NPV profile
NPV profile is constructed as a part of overall NPV analysis of capital budgeting. It uses different discount rates to display how a change in discount rate impacts the net present value (NPV) of a potential opportunity.
The projects with positive NPV profile are expected to increase the firm’s wealth and are considered good candidates to invest in. Moreover, it helps analysts evaluate the potential outcomes of multiple projects together by plotting their data on a single graph.
Other techniques of testing a project’s viability include payback method, discounted payback method, internal rate of return method and accounting rate of return method.

Leave a comment