Profitability index (PI)
Definition and explanation
Profitability index (PI) is the ratio of present value of a project’s expected future cash flow and initial investment needed to undertake the project. It helps companies and investors measure the expected return for each dollar invested into a project or venture. Other names used for profitability index are the value investment ratio (VIR) and the profit investment ratio (PIR).
A ratio of 1 indicates that the present value of the underlying investment just equals its initial cash out outlay and is considered the lowest acceptable number for a proposal. A less than 1 PI ratio means that the project’s present value would not recover its initial investment or cost. Theoretically, it reveals unprofitability of a proposed investment and suggests rejection of the same. In general terms, the higher the PI metric, the more attractive a proposed investment is.
In capital budgeting, profitability index can be applied to:
- evaluate the viability of an individual or multiple independent projects,
- choose the best one from two or multiple mutually exclusive projects, and
- rationing capital among proposed investments when available funds are limited.
We would discuss and exemplify the above three applications of profitability index later in this article, but let’s first look into how it is computed.
Formula of profitability index (PI)
The formula of profitability index can be presented as follows:

The numerator is the present value of cash flow that occurs after the initial funds have been invested into the project. The denominator consists of the total funds the firm initially needs to undertake the opportunity.
The profitability index, in fact, is another way of representing the net present value model. The only difference between two is that the NPV shows an absolute value whereas the PI measures the relative value in ratio format.
Example
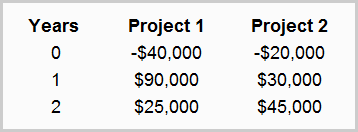
John Brothers Inc. uses a 14% discount rate for two available projects – project 1 and project 2. The relevant cash flows are as follows:

Required: For both project 1 and 2, calculate:
- the present value of cash flows that occur after initial investment.
- the profitability index (PI) ratio.
Solution
Project 1:
(i). Calculation of present value of cash flows after initial investment:
= [C1/(1 + 0.14)] + [C2/(1 + 0.14)^2]
= [$90,000/(1.14)] + [($25,000)/(1.14)^2]
= $78,947.37 + $19,236.69
= $98,184.06
By rounding to nearest whole dollar, we get $98,184.
(ii). Calculation of profitability index (PI) ratio:
*$98,184/$40,000
= 2.45
Project 2:
Calculation of present value of cash flows after initial investment:
= [C1/(1 + 0.14)] + [C2/(1 + 0.14)^2]
= [$30,000/(1.14)] + [($45,000)/(1.14)^2]
= $26,315.79 + $34,626.04
= $60,941.83
By rounding to nearest whole dollar, we get $60,942.
Calculation of profitability index (PI) ratio:
*$60,942/$20,000
= 3.05
The following table summarizes the results obtained from above calculations:

The NPV @ 14% in last column of the above table has been obtained by subtracting the initial investment at C0 date from the present value @ 14% discount rate.
Now that we have obtained the PI value for both the projects, let’s look into its application for appraising projects.
Application of profitability index (PI)
We can consider the following three situations to understand the use of profitability index computed in John Bothers’ example above:
(1). Project 1 and project 2 are both independent projects:
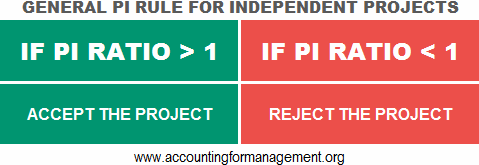
Assume that John Brother’s two projects are independent of each other. According to net present value (NPV) rule, both project 1 and project 2 are acceptable because both have a positive NPV. Whenever the NPV number is positive, the PI is greater then 1. Thus, the decision rule of profitability index for an independent project is:
- If PI ratio is greater than 1, accept the project.
- If PI ratio is less than 1, reject the project.

(2). Project 1 and project 2 are mutually exclusive projects:
Now we assume that John Brothers can undertake only one of these two projects. The net present value analysis favors project 1 because its NPV number is bigger than project 2. But the profitability index indicates otherwise and says that project 2 with its higher PI value is a better opportunity than project 1.
The profitability index, in this case, leads to a wrong selection. The problem is that PI ignores the difference of scale between two projects. When projects are mutually exclusive, PI suffers from the scale problem, similar to internal rate of return (IRR) method. Since profitability index is a ratio, it ignores that project 1 is larger than project 2. However, we can correct this flaw by applying an incremental analysis. For this purpose, we need to subtract the project 2 from project 1 as follows:

We can see that the PI number obtained through our incremental analysis is greater than 1. We should therefore select project 1 – the bigger project. Notice that the PI decision now agrees with the NPV decision.
(3). Capital rationing with limited funds:
In first two cases, we have assumed that John Brothers can always manage enough funds to undertake any profitable opportunities. Let’s now consider the case of capital rationing – the case where the company can’t attract enough capital to fund all projects with a positive net present value (NPV). Suppose, in addition to above two projects, John Brothers has a third project under consideration. The cash flows and PI ratios of all three projects are given in the following table:

Suppose further that the company has only $40,000 available to invest and all the projects are independent, not mutually exclusive. The company can invest these $40,000 in two ways. It can select either project 1 only or both project 2 and 3. Because of cash constraint, It can’t undertake both project 1 and another from project 2 and 3.
What should John Brothers do in this situation? The individual NPVs of project 2 and project 3 are smaller than project 1. However, if they are added together, the sum total is larger than project 1’s NPV. The common sense here dictates that the company should choose both project 2 and 3, and leave the first one.
What conclusion should we have in the light of NPV and PI rules? In the case of limited funds, we should rank projects according to profitability index (PI) ratios and not on the basis of their net present values (NPVs). Since project 2 and 3 both have higher PI values than project 1, they should be ranked ahead of project 1 while rationing the available capital.
Limitations of profitability index (PI)
The profitability index should be applied with care in real business decisions as it suffers from some serious flaws. Some important limitations of using the PI approach are discussed below:
- The profitability index would not work if funds are also insufficient beyond the period of initial investment. For example, we can see that the project 3 in above example has a negative cash flow of $10,000 on date 1 (C1). If another significant cash outflow occurs elsewhere in the company at date 1, the project 3 may have to be rejected. In other words, we can say that the profitability index fails to handle capital rationing over multiple time periods.
- The effectiveness of PI rule also gets impacted by an economics concept called “indivisibilities”. Imagine that John brothers, in above example, has $60,000 available for capital investment, not just $40,000. With this increased availability of funds, the company would have enough cash to invest in project 1 and 2. Since the sum total of NPVs of these two projects surpasses the sum total of NPVs of project 2 and 3, the company would be better served by choosing project 1 and 2 rather than project 2 and 3. Now, if we look at the profitability indexes, we find that they still show the highest ratios for project 2 and 3. With new investment limit of $60,000, the PI rule leads us to a wrong selection. Why is this happening? The key point to consider here is that the combination of project 1 and 2 uses up all available funds of $60,000 (= $40,000 + $20,000) whereas the combined initial investment of project 2 and 3 is only $40,000 (= $20,000 + $20,000). It means if project 2 and 3 are chosen over project 1 and 2, the remaining $20,000 would be left uninvested.
Although not a perfect approach, profitability index goes a long way toward handling of capital rationing, if used with caution.

A well researched and elaborative presentation. Well done. Do project managers really incorporate this knowledge in assessing viability?