Least squares regression method
Definition and explanation
Least squares regression method is a method to segregate fixed cost and variable cost components from a mixed cost figure. It is also known as linear regression analysis.
Least squares regression analysis or linear regression method is deemed to be the most accurate and reliable method to divide the company’s mixed cost into its fixed and variable cost components. This is because this method takes into account all the data points plotted on a graph at all activity levels which theoretically draws a best fit line of regression.
Linear regression is basically a mathematical analysis method which considers the relationship between all the data points in a simulation. All these points are based upon two unknown variables – one independent and one dependent. The dependent variable will be plotted on the y-axis and the independent variable will be plotted to the x-axis on the graph of regression analysis. In literal manner, least square method of regression minimizes the sum of squares of errors that could be made based upon the relevant equation.
The least squares regression method follows the same cost function as the other methods used to segregate a mixed or semi variable cost into its fixed and variable components. Let’s assume that the activity level varies along x-axis and the cost varies along y-axis. The following equation should represent the the required cost line:
y = a + bx
Where,
- y = total cost
- a = total fixed cost
- b = fixed cost
- x = number of units
The values of ‘a’ and ‘b’ may be found using the following formulas.
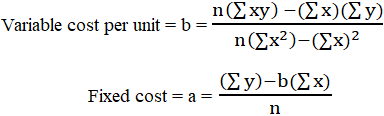
The derivations of these formulas are not been presented here because they are beyond the scope of this website.
Example
For example, Master Chemicals produces bottles of a cleaning lubricant. The activity levels and the attached costs are shown below:
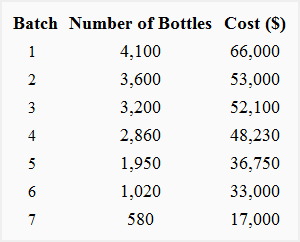
Required: On the basis of above data, determine the cost function using the least squares regression method and calculate the total cost at activity levels of 6,000 and 10,000 bottles.
Solution
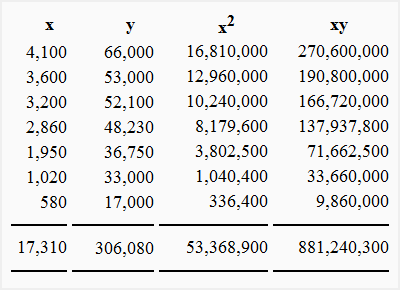
In our example:
- n = 7
- ∑x = 17,310
- ∑y = 306,080
- x2 = 53,368,900
- xy = 881,240,300
We can find the values of ‘a’ and ‘b’ by putting this information in the above formulas:
Computation of variable cost per unit (b):
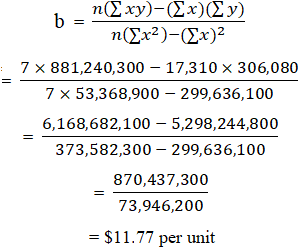
The value of ‘b’ (i.e., per unit variable cost) is $11.77 which can be substituted in fixed cost formula to find the value of ‘a’ (i.e., the total fixed cost).
Computation of total fixed cost (a):
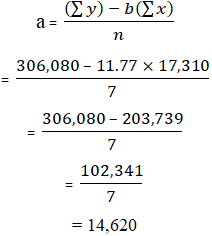
1. Using the method of least squares, the cost function of Master Chemicals is:
y = $14,620 + $11.77x
2. The total cost at an activity level of 6,000 bottles:
y = $14,620 + ($11.77 × 6,000)
= $85,240
3. The total cost at an activity level of 12,000 bottles:
y = $14,620 + ($11.77 × 12,000)
= $155,860
Limitations of least squares regression method:
This method suffers from the following limitations:
- The least squares regression method may become difficult to apply if large amount of data is involved thus is prone to errors.
- The results obtained are based on past data which makes them more skeptical than realistic.
very educative and precise
It is very educative and helpful.
I just got clarifications over my doubts on least quare regression method
This is helpful