Vertical (common-size) analysis of financial statements
Vertical analysis (also known as common-size analysis) is a popular method of financial statement analysis that shows each item on a statement as a percentage of a base figure within the statement.
To conduct a vertical analysis of balance sheet, the total of assets and the total of liabilities and stockholders’ equity are generally used as base figures. All individual assets (or groups of assets if condensed form balance sheet is used) are shown as a percentage of total assets. The current liabilities, long term debts and equities are shown as a percentage of the total liabilities and stockholders’ equity.
To conduct a vertical analysis of income statement, sales figure is generally used as the base and all other components of income statement like cost of sales, gross profit, operating expenses, income tax, and net income etc. are shown as a percentage of sales.
In a vertical analysis, the percentage is computed by using the following formula:
Percentage of base = (Amount of individual item/Amount of base item) × 100
A basic vertical analysis needs an individual statement for a reporting period but comparative statements may be prepared to enhance the usefulness of analysis.
Example:
An example of the vertical analysis of balance sheet and income statement is given below:
Comparative balance sheet with vertical analysis:
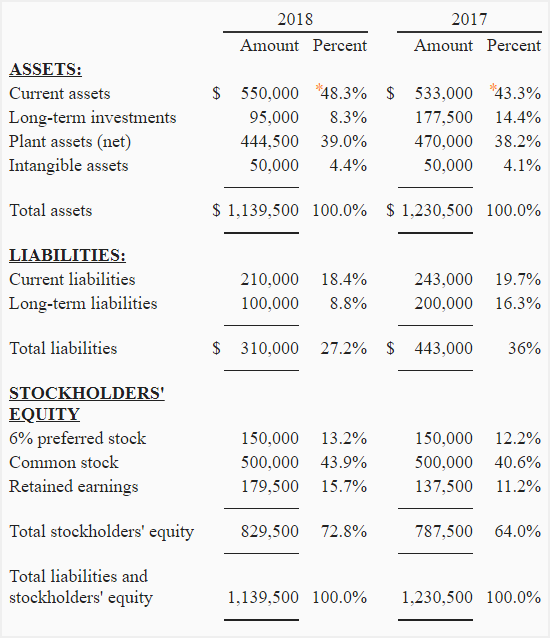
*Current assets:
2018: (550,000/1,139,500) × 100 = 48.3%
2017: (530,000/1,230,500) × 100 = 43.3%
Comparative income statement with vertical analysis:
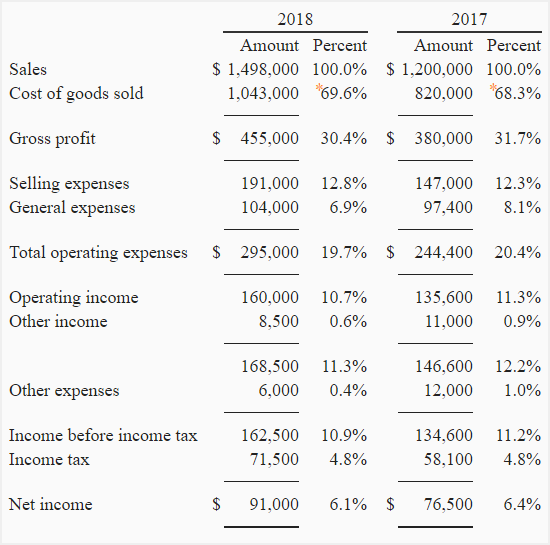
*Cost of goods sold:
2018: (1,043,000/1,498,000) × 100 = 69.6%
2017: (820,000/1200,000) × 100 = 68.3%
Vertical analysis states financial statements in a comparable common-size format (i.e., percentage form). One of the advantages of common-size analysis is that it can be used for inter-company comparison of enterprises with different sizes because all items are expressed as a percentage of some common number.
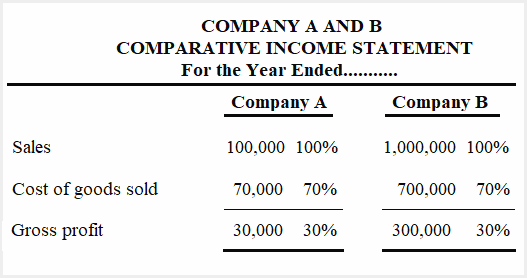
For example, suppose company A and company B belong to same industry. A is a small company and B is a large company. Company A’s sales and gross profit are $100,000 and $30,000 respectively whereas company B’s sales and gross profit are $1,000,000 and $300,000 respectively. If vertical analysis is conducted and sales figure is used as base, it would show a gross profit percentage of 30% for both the companies as shown below:
Thank you for the very useful services you are providing, it is really appreciable.
Your are welcome.
You have presented the horizontal analysis of current assets section and statement of retained earnings on horizontal analysis page. But on this page you have not given the vertical analysis of current assets section and the statement of retained earnings.
Also I cannot find any exercise or problem about vertical analysis in exercises and problems section of your website. Are you still preparing it?
We are working, will be available soon. Please check back again in a month.
This was tremendously helpful. Looking forward to more. Thank you.
Very helpful. What do you do for cashflow statements vertical analysis?
What are some advantages and disadvantages of this analysis technique? Thanks in advance.
Thanks. Very useful
My exam is in 2 days and i was looking for a formula to solve vertical analysis and this information is so useful and helped me to understand more. Thank you so much!!
Totally helpful. looking forward for more insights.
WAS TOO GOOD ..APPRECIATION
Much more clearly laid out than any of my textbooks. This made it simple to understand and remember. Thank you!!!
Thank you! So helpful! Sooo much easier to comprehend than my textbook!
Thank you for this useful info. It is my first participation in this website but will not be the last one 🙂
How can I calculate the vertical analysis for ratios?! What would be my base
It was very informative, thanks
it is useful information with horizontal format but please update this article along with vertical format because it’s new corporate trend of presenting accounting statement ..
thnx a lot 4 sharing useful infos and rendering apreciable sevices keep it up…… stay bless
It was very informative, thanks
Was the Sales are always a 100%? In Statement of Income. What formula will be used as the based year? The Total assets or the Sales? In horizontal analysis if the given problem was from Year 1-5 (multiple year)??
Yes it is always 100%,definitely the sales will be used in the income statement.
What if the problem are comparing more than 2 years? If it was a multiple years comparison using the horizontal analysis in Statement of Income? How come? What formula will I’ll be using to this?
if more than one year data is compared then the base year is specified in the question
it is very heplful , thank you so much 🙂
It is very helpful,and really help me,the way utilized for BBA lecture course.
Salam Mr. Safi,
Where do/did you study accounting?
i tried every where from thi i got clear information its very helpfull to me
Thanks a lot.. your website is very
helpful. Godbless.
Thank you so much for this information. Its very helpful
you guys are the best. God bless.
SO HELPFUL
how to do comparative balance sheet when 3 years information is given ..
so helpful!
can we solve common size statements sum by only one year detail if yes how?
Your were born a teacher,precise and exact .
What about vertical analysis of cash flow statement?
Thanks a lot, this made its easy to understand and very helpful.
The example of comparative balance sheet December 31, 2008 & 2007.
In 2007 figure of total stock holders’ equity is $787,500 but my total is $823,500 (which preferred 6% stock $150,000,
common stock $500,000, retained earnings $173,500). How total is a $787,500?
Could you explain about this?
I found, should retained earnings figure is a $137,500 NOT $173,500
Your explanation and examples are very helpful. Thank you so much!
Thank you. Very helpful.
Pls send the interpretation of the common size balance sheet
hey MISS or BRO ,can you help me to comment on the vertical common-size analysis ? very appreciate…
How do we interpret on the vertical analysis???
Thanks alot for sharing. Hope to see more and emerging standards set for them
what if the given problem is perform a vertical analysison the financial statemet but there is no sales? like for example:
net sales in 2020 amount 800 and percent is blank 2019 amount 700 percent blank
cost odf good sold 2020 amount blank percent blank 2019 amount (320) percent blank.. its like that..
hoping for ur response.