Receivables turnover ratio
Definition and explanation
Receivables turnover ratio (also known as debtors turnover ratio) is an activity ratio which measures how many times, on average, an entity collects its trade receivables during a selected period of time. It is computed by dividing the entity’s net credit sales by its average receivables for the period.
This ratio, together with average collection period ratio, indicates how quickly a business entity can be expected to convert its credit sales into cash and thus helps evaluate the liquidity of its receivables. Like some other activity ratios, receivables turnover ratio is expressed in times like 5 times per quarter or 12 times per year etc.
Commercial entities should determine their receivables turnover ratio from time to time because it is directly linked with the availability of cash or its equivalent, which they can use to meet their day to day operating expenses and short-term obligations.
Formula of receivables turnover ratio
The formula of receivables turnover ratio is given below:
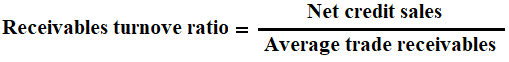
The two components of the formula of receivables turnover ratio are “net credit sales” and “average trade receivables”. The formula states that the numerator should include only credit sales. However, in examination problems, the examiners often don’t provide a separate breakdown of cash and credit sales. In that case, students should use the total sales number as the numerator, assuming all the sales are credit sales.
In denominator part of the formula, the average receivables are equal to opening receivables balance plus closing receivables balance divided by two. If the opening balance is not given in the question, the closing balance should be used as denominator. For the purpose of receivables turnover ratio, students should bear in mind that opening and closing balances of receivables include the balances of both accounts receivable as well as the balances of all valid notes receivable that the entity holds at the start and end of the period. Let’s exemplify the calculation below.
Example
The selected data about sales and receivables of Maria Trading Company is provided below:
- Cash sales: $1,250,000
- Credit sales: $1,275,000
- Accounts receivable – January 1, 2023: $200,000
- Accounts receivable – December 31, 2023: $125,000
- Notes receivable – January 1, 2023: $75,000
- Notes receivable – December 31, 2023: $100,000
Required: How may times, on average, the company collects its receivables? Hint: Compute receivables or debtors turnover ratio.
Solution:
$1,275,000/$250,000*
= 6 times
*Average trade receivables:
($325,000+$175,000)/2 = $250,000
Maria’s receivables turnover ratio is 6 times for the year 2023 which means it, on average, has collected its receivables 6 times during the year. To analyze how efficient the company has been in collecting its receivables during this period, it can compare this ratio with its competing entities as well as the past years’ ratio of its own.
Now we can use this ratio to calculate Maria’s average collection period ratio which would reveal the average number of days the company takes to collect a credit sale. We can do so by dividing the number of days in a year by the receivables turnover ratio.
365/6 = 60.83 days
Maria’s average collection period is 60.83 days, as computed above. It means the company, on average, takes 60.83 days to collect a receivable. Whether this collection period of 60.83 days is good or bad for Maria depends on the terms of payment it offers to credit customers. For example, if Maria’s credit terms are 90 days, then the average collection period of 60.83 days is perfectly fine. But suppose, if its credit terms are 30 days or less, then an average collection period of 60.83 days would certainly be worrisome for the company.
Significance and interpretation
Generally, a higher receivables turnover ratio indicates that the receivables are highly liquid and are being collected promptly. A low ratio, on the other hand, signifies less liquid receivables and may impair the entity’s liquidity position in the eyes of stakeholders and analysts, even if a short-term solvency metric like current or quick ratio exhibit satisfactory numbers. A low turnover ratio may also be caused by the entity’s own inabilities, like following an inappropriate credit policy or having defects in its collection process etc.
Receivables turnover ratio is more useful when used in conjunction with short term solvency ratios like current ratio and quick ratio. These short term solvency indicators measure the liquidity position of the entity as a whole and receivables turnover ratio measure the liquidity of accounts receivable as an individual current asset. It is much like the inventory turnover ratio which measures how fast the inventory is moving in a business.
No single rule of thumb exists to interpret receivables turnover ratio for all companies. An analyst can compare the entity’s efficiency in collecting its receivables by comparing its ratio with industry’s norm as well as the ratio of others having similar business model, size and capital structure. In addition, he can compare the ratio with entity’s own past years’ performance.
Managers should continuously track their entity’s receivables turnover ratio on a trend line to observe the gradual ups and downs in turnover performance.
Limitations and issues with using receivables turnover ratio
Like other efficiency measurements, receivable turnover ratio suffers from a number of issues and limitation. Some of them are briefly discussed below:
- Receivables turnover ratio does not necessarily reflect the creditworthiness of individual receivables. The calculation of this metric is based on the average receivables for a selected period. A careful investigation of receivables aging report is needed to gauge the status and reliability of each credit customer.
- A very high turnover metric might indicate that the management is adopting an excessively conservative credit policy by which it allows credit sales to only highly creditworthy customers, driving away others to competitors. An entity with unnecessarily too restrictive credit policy may suffer from lost revenue, reduced profit and therefore slower growth.
- A low receivables turnover ratio does not necessarily reflect an inadequate credit policy or inefficiency on the part of collection personnel. Instead, it may be caused on account of negligence of employees working in other areas of the organization. For example, an inefficient shipment and delivery process can be a major reason of delayed payments. If faulty, broken, unfit or otherwise undesired items are frequently dispatched to customers, they would certainly not accept them and refuse to make the payment unless the right products are delivered to them within the reasonable time.
- Seasonal businesses generally observe a significant variation in their receivables throughout the year. The analysts should therefore be careful in selecting the beginning and ending points for obtaining the average receivables balance of such businesses. A general approach for levelling any seasonal gaps is to compute the ratio for a full year period by using the average of ending balances of all the months as denominator of the formula. This is because an arbitrarily selected period might provide misleading or inadequate values for both numerator and denominator and the ratio derived from such values may not reflect the entity’s actual collection performance.
- Some companies calculate their receivables turnover ratio a little bit differently. Instead of net credit sales, they use the total sales value as numerator of the formula. While this approach may exhibit a slightly higher ratio number than it should actually be, the purpose may not be to conceal the fact or mislead the users. The analysts and investors should, therefore, investigate the way the company has driven the ratio number or they can compute the ratio independently on their own.
Leave a comment