Exercise-7 (Basic CVP analysis, CVP graph or break even chart, break-even analysis)
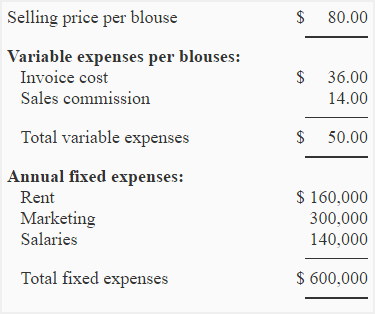
Beta company sells blouses in Washington, USA. Blouses are imported from Pakistan and are sold to customers in Washington at a profit. Salespersons are paid basic salary plus a decent commission of $14 on each sale made by them. Selling price and expense data is given below:
Required:
- Compute the break-even point in units and in dollars using the information given above.
- Prepare a CVP graph (break-even chart) and show the break-even point on the graph.
- What would be net operating income or loss if company sells 18,500 blouses in a year?
- If the manage is paid a commission of $6 blouse (in addition to the salesperson’s commission), what will be the effect on company’s break-even point?
- As an alternative to (3) above, company is thinking to pay $6 commission to manager on each blouse sold in excess of break-even point. What will be the effect of these changes on the net operating income or loss of the Beta company if 23,500 blouses are sold in a year?
- Refer to the original data. What will be the break-even point of the company if commission is entirely eliminated and salaries are increased by $214,000?
Solution:
(1). Calculation of break-even point:
a. Equation method:
SpQ = VeQ + Fe
$80Q = $50Q + $600,000
$80Q – $50Q = $600,000
$30Q = $600,000
Q = $600,000/$30
Q = 20,000 blouses
20,000 blouses × $80.00 per blouse
= $1,600,000
b. Contribution margin method:
Break-even point = Fixed expenses/Contribution margin per unit
= $600,000/$30*
= 20,000 blouses
20,000 blouses × $80.00 per blouse
= $1,600,000
*$80 – $50 = $30
Alternatively;
Break-even point = Fixed expenses/CM ratio
= $600,000/0.375*
= $1,600,000
*$30/$80 = 0.375
(2). CVP graph or break-even chart:

(3). Net operating income or loss if 18,500 blouses are sold in a year

An alternative and more simple approach is given below:
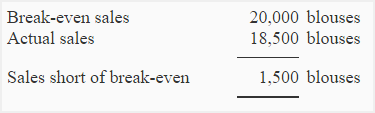
Net operating loss = Sales short of break-even × Contribution margin per unit
= 1,500 blouses × $30
= $45,000
(4) Break-even point if manager is also paid a commission of $6 per blouse sold:
The payment of a commission of $6 to manager will increase variable expenses and decrease contribution margin. Now the variable expenses will be $56 ($50 + $6) per unit and contribution margin will be $24 ($80 – $56) per unit.
a. Equation method:
SpQ = VeQ + Fe
$80Q = $56Q + $600,000
$80Q – $56Q = $600,000
$24Q = $600,000
Q = $600,000/$24
Q = 25,000 blouses
25,000 blouses × $80.00 per blouse
= $2,000,000
b. Contribution margin method:
Break-even point in units = Fixed expenses/Contribution margin per unit
$600,000/$24*
25,000 blouses
25,000 blouses × $80.00 per blouse
= $2,000,000
*$80 – $56 = $24
Alternatively;
Break-even point = Fixed expenses/CM ratio
= $600,000/0.30*
= $2,000,000
*$24/$80 = 0.30
(4) Effect on net operating income or loss if manager is paid a commission of $6 on each blouse sold after break-even point:
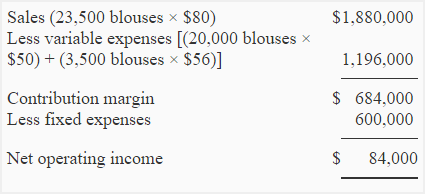
Alternatively the net operating income of $84,000 may also be computed by using the following simple approach:
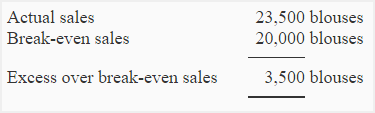
3,500 shirts × $24 per shirt* = $84,000 profit
*[$80 – ($50 + $6)] = $24
(5) Break-even point after elimination of commission and increase in salaries:
The new variable expenses are $36 (invoice cost, no commission) and new fixed expenses are $814,000 ($600,000 + $214,000).
a. Equation method:
SpQ = VeQ + Fe
$80Q = $36Q + $814,000
$80Q – $36Q = $814,000
$44Q = $814,000
Q = $814,000/$44
Q = 18,500 blouses
18,500 blouses × $80.00 per blouse
= $1,480,000
b. Contribution margin method:
= $814,000/$44*
= 18,500 blouses
18,500 blouses × $80
= $1,480,000
*$80 – $36 = $44
Alternatively;
Break-even point = Fixed expenses/CM ratio
= $814,000/0.55*
= $1,480,000
*$44/$80 = 0.55
Method is clearly clarified. This could include information about fixed costs, variable costs, selling price per unit, etc.