Exercise-24: Preference ranking of investment projects
Learning objective:
This problem illustrates the computation of profitability index and its use in ranking investment proposals.
Martin Company is considering the four different investment opportunities. The selected information about each proposal is given below:
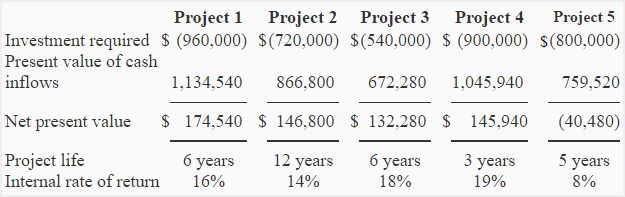
The present value of cash inflows given above have been computed using a 10% discount rate. The company is unable to accept all available projects because the funds available for investment are limited.
Required:
- Compute the profitability index (present value index) for all the projects.
- Rank the four investment projects according to preference using:
(a). net present value (NPV).
(b). profitability index (PI).
(c). internal rate of return (IRR). - Which one is the best approach for Martin Company to rank five competing projects?
Solution:
(1). Computation of profitability index:
Formula of profitability index (or present value index) is:
Profitability index = Present value of cash inflows/Investment required
- Project 1: $1,134,540/$960,000 = 1.18
- Project 2: $866,800/$720,000 = 1.20
- Project 3: $672,280/$540,000 = 1.24
- Project 4: $1,045,490/$900,000 = 1.16
- Project 5: $759,520/$800,000 = 0.95
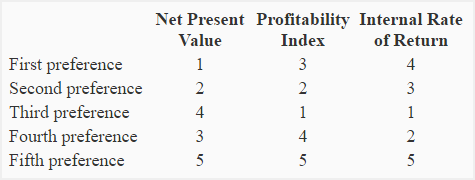
(2) Preference ranking of projects:
(3). The best ranking approach:
The best method of ranking projects depends on the availability of good reinvestment opportunities. Under internal rate of return (IRR) method, we assume that the funds released from a project are reinvested in another project yielding the internal rate of return equal to the previous project. According to IRR, the project 4 is ranked at number one with 19% IRR. It means any funds released from project 4 must be reinvested in another project yielding an internal rate of return of at least 19% but It might be difficult to find a project with such a high IRR.
The profitability index (sometimes referred to as present value index) measures the present value of cash flow generated by each dollar invested in a project. It assumes that the funds released from a project are reinvested in another project offering a return equal to the company’s discount rate – 10% in this problem. The profitability index is generally considered the most dependable method of ranking competing projects.
Although, NPV method considers the net present value of cash flows, it does not look at the quantum of investment required to undertake each competing project. This method is, therefore, not appropriate for ranking competing projects that require different amounts of investment. For example, project 3 is ranked at number four because of its low NPV but is the best option if we take into account the discounted value of cash brought in by each dollar invested in the project, as measured by the profitability index.
Conclusion:
From above discussion, we can conclude that the profitability index (or present value index) is the most appropriate and dependable method of ranking projects for Martin Company.
Thank you