Exercise-4: Net present value (NPV) method with uneven cash flows
Learning objective:
This exercise first computes the present values of cash inflows of two proposals and then compares them on the basis of their net present and profitability index values.
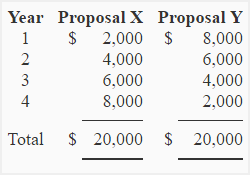
Proposal X and proposal Y both require an initial investment of $10,000 and both are expected to generate a cash inflow of $20,000 over their four years lives. The net cash inflow for each year of life of two proposals is given below:
Required:
- Compute the present value of cash inflows generated by both the proposals assuming a discount rate of 18%.
- Which of the two proposals is better if compared using net present value (NPV) method?
Solution:
(1). Present values of proposal X and proposal Y:
Both the proposals generate uneven cash inflows. The present value of cash inflow of both the proposals would, therefore, be computed by multiplying the net cash inflow generated in each individual year by the present value of $1 at given interest rate of 18%. These calculations are given below:
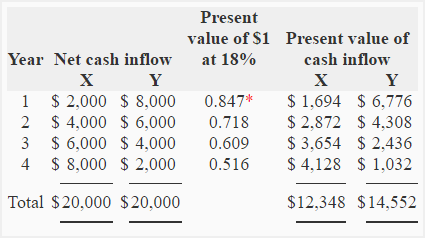
*Value from present value of $1 table.
Notice that both the proposals generate equal cash inflow of $20,000 in their 4-year period life but present value of proposal Y’s cash inflow is greater than the present value of proposal X’s cash inflow by $2,204 (= $14,552 – $12,348) . The reason is that proposal Y generates most of its cash inflow in earlier years whereas proposal X generates most of its cash inflow in later years. It reminds us that the money has a time value.
(2). Comparison of two proposals using net present value (NPV) method:
NPV = Present value of cash inflows – Present value of cash outflows
- Proposal X: $12,348 – $10,000 = $2,348
- Proposal Y: $14,552 – $10,000 = $4,552
The net present value of both the proposals are positive and therefore both are acceptable if evaluated using NPV method. The proposal Y, however, promises a higher net present value than proposal X and is a better investment to choose.
Alternatively, we can calculate the profitability indexes of two proposals for their preference ranking:
- Proposal X: $12,348/$10,000 = 1.235
- Proposal Y: $14,552/$10,000 = 1.455
Both the proposals have PI values of greater than 1 which signifies that both have positive net present values and are acceptable investments. However, proposal Y is preferred because of its higher PI value.
Leave a comment